CRUISE’S SAFETY RECORD OVER 1 MILLION DRIVERLESS MILES
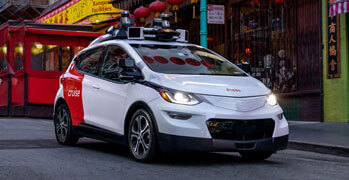
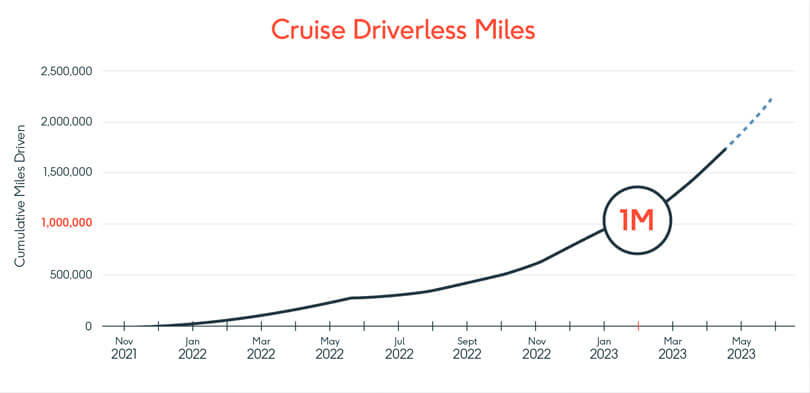
When Cruise’s driverless AVs first took to public roads in 2021, we made history as the first company to complete a fully driverless ride in San Francisco. By February 2023, our AVs collectively drove one million driverless miles — a distance equivalent to more than 40 laps around the planet — in fifteen short months. We’re expecting that number to double by mid 2023 and continue to scale exponentially as our fleet grows in the coming years.

We are incredibly proud of the many technical innovations developed at Cruise that made this achievement possible, but we aren’t satisfied with just building great technology. We’re obsessed with building a product that is safe, accessible, environmentally-friendly, and dependable to the communities we serve.
With this in mind, we are pleased to present Cruise’s safety record over the course of our first million driverless miles. When benchmarked against human drivers in a comparable driving environment, our AVs were involved in:
> 54% fewer collisions overall
> 92% fewer collisions as the primary contributor
> 73% fewer collisions with meaningful risk of injury
Additionally, many of the collisions our AVs did encounter were at low speeds and were not caused by our AVs’ driving behavior.
With our observed performance indicating that our AVs operate more safely on average than human-operated vehicles, we are more committed than ever to partner with our community and regulatory stakeholders to expand our safe driverless operations nationwide, and worldwide.
Our Mission Is Urgent
A discussion of AV safety would be incomplete without first discussing the current reality of human drivers behind the wheel. The numbers are as clear as they are catastrophic:
> In 2022, nearly 46,000 people were killed in car crashes in the US.
> This represented a 22% percent increase in traffic-related deaths since 2019.
> 1.3 million people were killed globally, nearly 3,700 per day.
> Auto collisions continue to be the #1 cause of death for US teenagers.
> Auto deaths & injuries are projected to cost the world economy $1.8 trillion (between 2015-2030).
To put this into context, the COVID-19 global pandemic killed nearly 7 million people in just over 3 years and threatened to shut down the whole world. Over a similar time span, nearly 4 million people will have died in car accidents; and yet, we have collectively become desensitized to the carnage on our roads.
There is a better, safer way: a driverless future with fewer collisions, relaxed riders, and at-ease pedestrians.
At Cruise, we know that our driverless AVs can move these tragic statistics in the opposite direction. Research from the RAND corporation indicates that even a modest improvement in safety by the first version of AVs could have a dramatic impact in saving lives. It projected that deploying AVs that are on average ten percent safer than the average human driver could prevent 600,000 fatalities in the United States over 35 years. Based on our first million driverless miles of operation, it appears we are on track to far exceed this projected safety benefit.
Cruise’s Safety Record
Throughout our first million driverless miles, our AVs were involved in fewer collisions, were the primary contributor to fewer collisions, and were involved in fewer severe collisions with meaningful risk of injury, than human drivers were in a comparable driving environment.
To unpack this safety record, we will explain our driving environment; how we measured human driving performance; and how our AVs performed in comparison.
Our driving environment
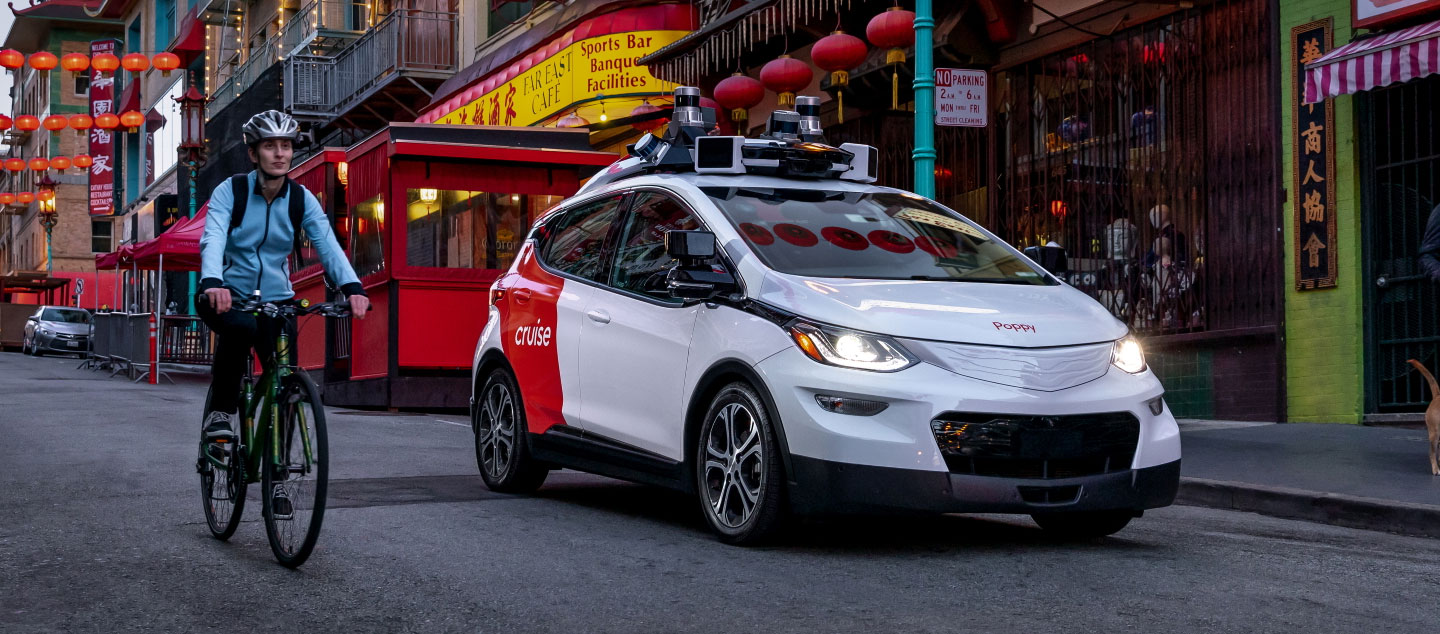
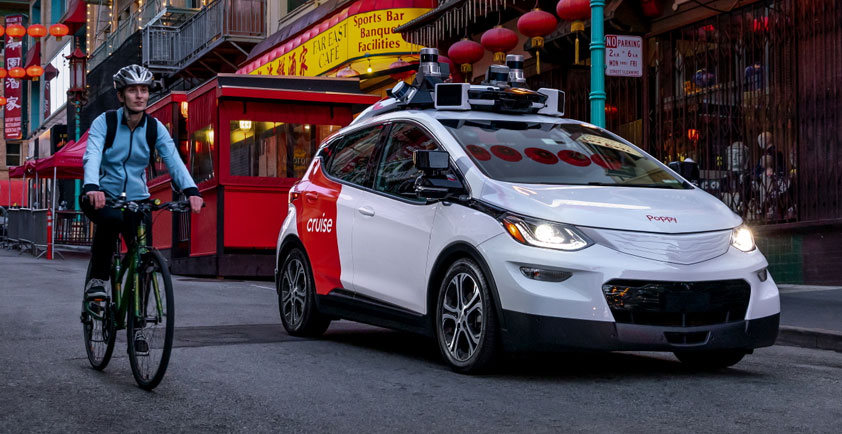
To explain our on-road safety performance, we first consider our driving environment. Cruise AVs drove nearly 100% of our first million driverless miles in San Francisco, a notoriously complex urban environment with unique challenges:
> A dense population of 19,000 people per square mile
> A higher density of pedestrians, cyclists, scooterists than almost any other US city
> Frequent encounters with double-parked vehicles, construction zones, road closures, and other road hazards
> Frequent instances of reckless driving, such as aggressive cut-ins and stop sign blow-throughs
Driving safely is extremely challenging in dense urban environments. Here’s a glimpse into the some of the complex, unpredictable, and sometimes bizarre situations we’ve encountered in San Francisco:
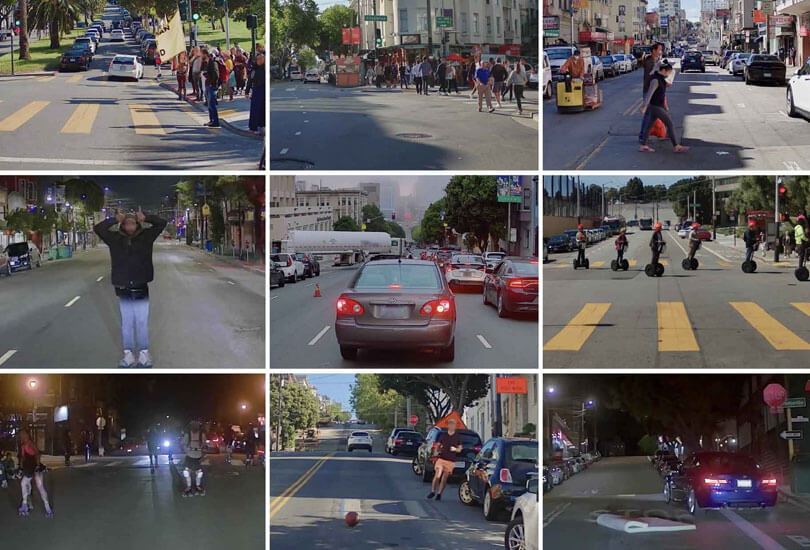
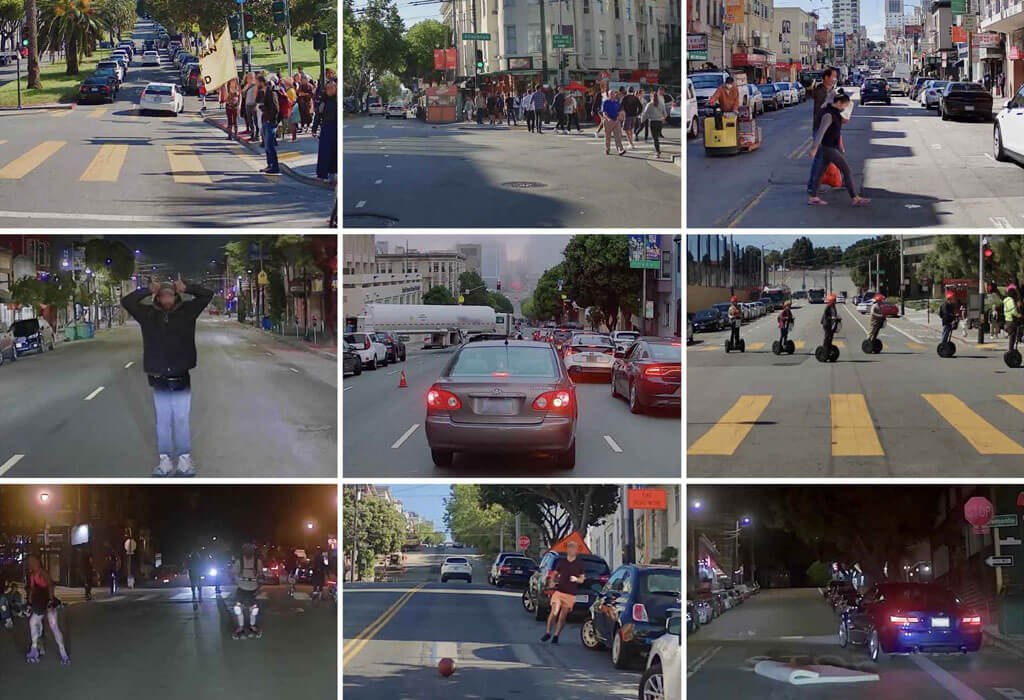
Despite these challenges, and in fact because of them, we intentionally chose to deploy our AVs in San Francisco. Driving in one of the most difficult environments in the US has allowed us to deliver a safer experience where the need is most pressing, and has accelerated our progress towards deploying AVs in other places where this need exists.
How often humans crash in San Francisco
One of our key methods of measuring the safety performance of our AVs is to compare the collisions encountered by our AVs with those of humans in a comparable driving environment.
This comparison is not easy to make. While we have collected a wealth of data on our own AVs’ safety performance – leveraging our highly-sensitive sensors, automatic data logging systems, and operational infrastructure – there is relatively little data available to measure human driving performance, which is mostly limited to particularly significant collisions or moving violations.
In fact, the statistic most often cited in the US as the measure of how well humans drive used an overly simplified approach of taking all of the miles driven in all environments by all drivers in a given year, and dividing it by the total count of collisions reported that year. Based on this approach, human drivers drove approximately 515,000 miles for every reported collision in 2021.
But it’s important to study this figure more carefully. If the average American drives approximately 11,000 miles per year, applying a collision rate of one collision per 515,000 miles would mean that even in major cities, we’d expect only one collision (including fender benders) per driver every 45 years – roughly an entire driving lifespan for a human. As you might suspect, this is an overly optimistic portrayal of the average American driver, especially those who drive in major cities.
Why might this be? To start, let’s view this from the perspective of each vehicle. About 90% of these reported collisions involve more than one vehicle, so we’d need to count a collision for each vehicle involved. Many minor collisions are not even reported, so those are entirely missing from this statistic. Lastly, collisions occur much more frequently in dense urban environments such as San Francisco than the millions of miles of lightly trafficked rural roads and highways. For these and many other reasons, we needed better data than what is widely available.
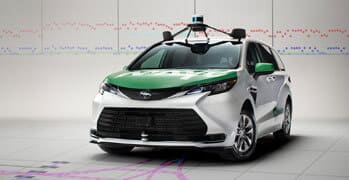
We decided to approach some of the most respected transportation research institutions in the country to help us create better statistics. We partnered with the University of Michigan Transportation Research Institute (UMTRI) and Virginia Tech Transportation Institute (VTTI) to develop a multi-year study of naturalistic human ridehail driving collecting over 5.6 million miles of data in San Francisco.
By leveraging this study, we were able to derive the approximate frequency of collisions by human-operated ridehail vehicles as fewer than 20,000 miles per collision in San Francisco. We were able to review the details of the collisions to determine additional characteristics, including whether the ridehail vehicle was the primary contributor to the collision, and whether the collision resulted in, or could have resulted in, a serious injury.
How our AVs compare to the human ridehail benchmark
In order to understand our safety record, we must first review the following three characteristics:
Frequency: To accurately compare how often our AVs encountered collisions when compared to human drivers, we identified whether the collisions detected by the AV would have been reported by human drivers. While many collisions involving human drivers go unreported, our AVs are equipped with high-fidelity sensors that can detect the lightest tap of a hand, and our operators are trained to follow our standard collision response protocol. We developed a reasonable comparison by matching the detection thresholds between the instrumented human dataset and that of our AVs using factors such as vehicle kinematics, whether safety features such as airbags were deployed, and the contents of official collision reports.
Primary Contribution: Many of the collisions that our AVs encountered resulted from the distracted, reckless, and/or illegal behaviors of other drivers. In each collision, we investigated the circumstances closely to understand how it occurred and whether it could reasonably have been avoided by our AV through defensive driving. We designated our AVs as having the primary contribution if our AV contributed more to a collision outcome than the other party. Identifying the nature of our AVs’ contribution helps us target areas where we can significantly improve our own safety performance, including our development of defensive driving practices to mitigate risks posed by unsafe driving behaviors of other drivers.
Risk of Injury: The most significant indicator of safety performance is whether a collision presented a meaningful risk of injury, which we define as requiring application of medical examination or treatment. While avoiding the cost and inconvenience of property damage is an important aspect of safety, vehicle safety is first and foremost about protecting vehicle occupants and other road users from physical harm. Many of the collisions involving our AVs took place at low speeds, with low risk of injury or damage to the parties involved. Our comparison measured all collisions with meaningful risk of injury.
Based on these three key areas of comparison, here is how our observed performance compares to the human benchmark.
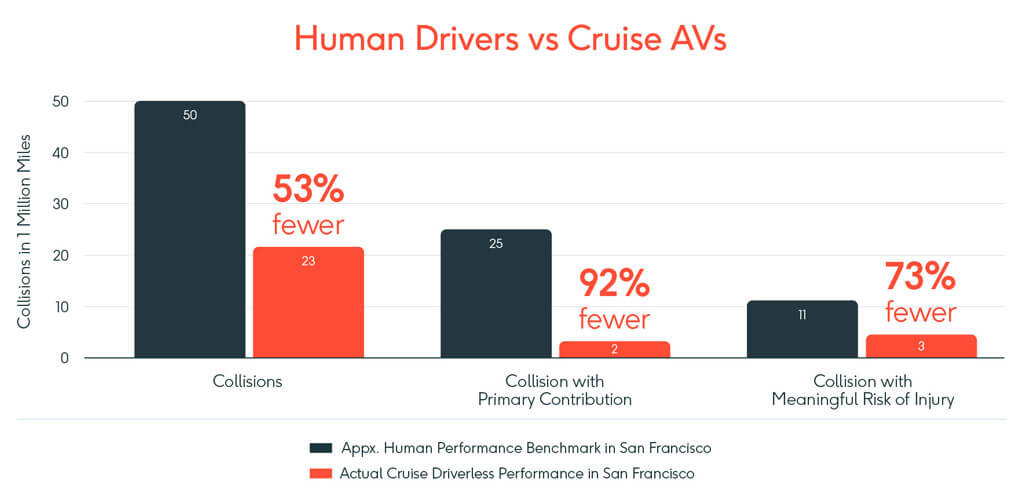
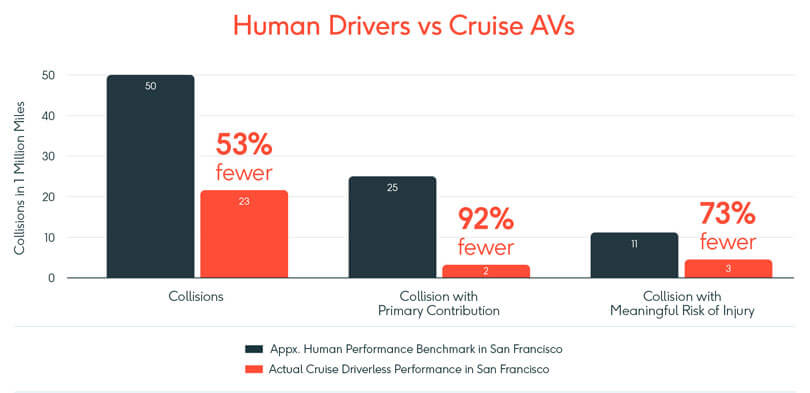
Based on these measurements, it is clear that in our first million driverless miles, our driverless AVs have outperformed the average human driver in San Francisco by a large margin.
A closer look at driverless collisions
In addition to the safety record detailed above, a closer look at the collisions we encountered shows that many of our collisions were at low speeds and were not caused by our AVs’ driving behavior.
The majority of these collisions resulted from distracted or reckless human drivers making obvious mistakes. Here are some examples of the types of collision scenarios we’ve encountered most often:
Here’s a breakdown of the collision events our AVs encountered in our first million driverless miles:
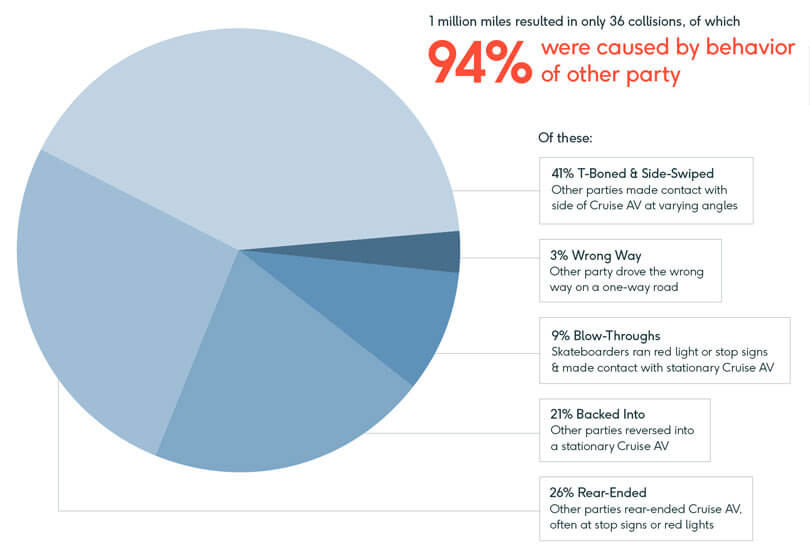
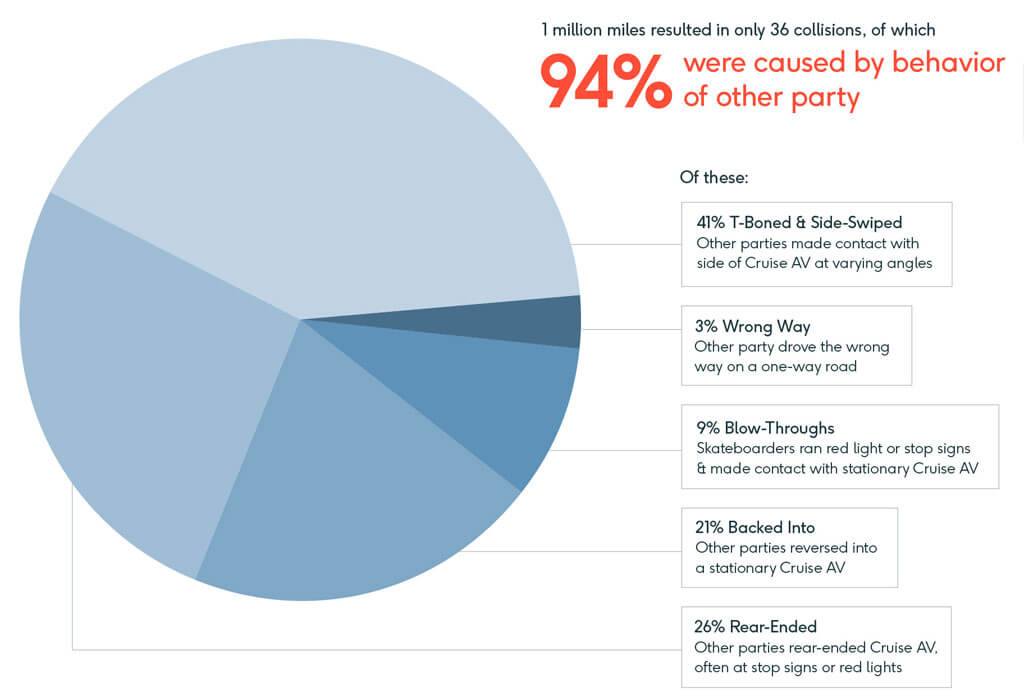
At Cruise, we believe all vehicles, whether human-operated or autonomous, have a special responsibility to advance the safety of Vulnerable Road Users (VRUs) like pedestrians, cyclists, and other road users not in vehicles. We note that 5 out of the 36 driverless collisions involved VRUs coming in contact with an AV. However, in all 5 collisions, the VRU made contact with a stationary Cruise AV, and none of these collisions resulted in any reported injuries.
Only 1 collision in 1,000,000 driverless miles resulted in a reported injury. This particular collision took place while our AV was making an unprotected left turn. At the time of collision, the other party was driving straight in a turn-only lane, and was traveling at more than 40 mph on a road with a posted speed limit of 25 mph. Although the police assigned responsibility for this incident to the other driver, Cruise chose to improve its software to avoid recurrence of this one-time event by building in additional defensive driving behaviors. We issued a voluntary recall to notify regulators and the public of this change.
You can see our full catalog of collision events here.
We are proud to say that, in the first million driverless miles of Cruise’s safety record, our driverless AVs outperformed the human benchmark by encountering fewer collisions, being the primary contributor to fewer collisions, and encountering fewer collisions with meaningful risk of injury. Many of the collisions we did encounter were at low speeds and were not caused by our AVs’ driving behavior. While our safety record is still in the early stages of gaining the statistical power that arises from collecting many millions of more miles, we are committed to continually monitor and report on our safety performance. However, even at this early stage, our safety performance across our first million driverless miles presents compelling evidence that AVs are already beginning to make our roads and communities safer.
The Road Ahead
The current trends in transportation safety indicate that human driving has worsened in recent years, despite advancements in automotive safety features like airbags and proximity sensors. In contrast, the safety record from our first million driverless miles is just the starting point in our AVs’ safety performance. Advancements in technologies such as AI and machine learning, higher-performance computers, and state-of-the-art sensors offer a previously unimaginable potential for improvements in our AVs’ technology.
We remain committed to drive continuous safety improvements, magnify our impact with scale, and engage with our communities to create a safer, cleaner, and more accessible future in transportation.
Driving continuous safety improvements
We’ve achieved the impressive safety record of our first million driverless miles through the safety-minded approach detailed in our 2022 Safety Report. This report, which is the AV industry’s most comprehensive and transparent report of its kind, goes into detail on how we protect and improve our safety performance on a daily basis.
Our core Safety Actions include:
> Promoting Safety: We are fundamentally safety-minded, and leverage our state-of-the-art Safety Management System to cultivate safety thinking into every aspect of our AV development lifecycle.
> Building Up Capabilities: We practice a tried-and-true approach to innovative product development in which we start with small, contained amounts of exposure to safety risk, then gradually expand once we observe tangible performance improvements.
> Driving Down Risks: We leverage a Safety Risk Management process across our system to identify risks and corresponding mitigations, thereby minimizing safety risks that may emerge in our daily driverless operations.
> Iterating Quickly: We feed the rich data collected from our fleet of AVs into our continuous feedback loop to identify findings and iterate quickly to roll out improvements and maintain safety.
> Responding Live: We provide 24x7 live support through our Operations Control Center during driverless operations for safe and swift response to on-road events.
Through these Safety Actions, we will continue to improve our safety record – and reverse the tragic direction of the transportation statistics we see today – through the continuous updates that we roll out mile after driverless mile.
Magnifying impact with scale
While nearly all of our first million driverless miles were driven in San Francisco, we have already expanded our driverless fleets into Austin and Phoenix, with more on the way. We will leverage what we’ve learned from years of operation in San Francisco’s dense urban environment to get a head start in any city that welcomes our driverless AVs. To achieve our mission of making roads safer, we are working to expand our driverless services nationwide, engaging with industry and regulatory partners to design a holistic approach to roadway safety.
Our goal to make a positive impact on our communities extends beyond road safety to include environmental sustainability and accessibility to underserved communities. We’ve engaged with the following partner organizations at the national, state and local level to improve transportation safety, reduce harmful emissions, and promote accessibility:
> Cyclist organizations, such as the League of American Bicyclists, to gain crucial feedback to ensure our AVs can address long-standing challenges experienced by cyclists when interacting with vehicles.
> Road safety organizations, including the Vision Zero Network, to reduce traffic-related collisions and fatalities.
> Farms in our renewable energy initiatives, Farm to Fleet, which has helped us displace 785.6 metric tons of upstream carbon emissions.
> Disability community organizations, such as National Federation for the Blind, American Council on the Blind, and United Spinal, to gain insights and feedback on how AVs can improve transportation access.
Cruising towards a safer future
Although we take great pride in our first million miles of operation, we recognize that this is only the start of a journey with many new challenges still ahead. We will face those challenges by using the same foundational principles that we have used to date: a commitment to driving continuous safety improvements, extending our impact with scale, and informing and engaging our communities to create a safer, cleaner, and more accessible future in transportation.
A core value at Cruise is to #behumble. This means we always look for opportunities to improve and expand our AVs’ capabilities. It took thousands of highly trained engineers to achieve the driving performance of a typical 16-year-old, and millions of engineering hours to subsequently achieve our current performance of operating more safely than the average human-operated vehicle. We will continue to work tirelessly to accelerate our progress day by day, and expand our operations wherever we can to maximize our positive impacts on our roads and communities as soon as possible.
We are incredibly grateful to the many members of our community who have collaborated with us to get this far. We look forward to bringing our safe, clean, and accessible AVs to all the cities and communities that welcome the driverless revolution.
Let’s Cruise.
Author - Louise Zhang - VP, Safety & Systems - Cruise
SUPERSTAR STARTUPS